
Analyzing your Instagram followers can boost engagement and revenue. Here's how:
-
Segment Your Followers:
- Group them by demographics (age, gender, location) and behavior (likes, shares, saves).
- Use Instagram Insights to access this data.
-
Set Up Instagram Insights:
- Switch to a Business or Creator account for free.
- Insights provide metrics like follower growth, top locations, and engagement patterns.
-
Understand Behavioral Metrics:
- Saves and shares matter most for Instagram’s algorithm.
- Identify key follower types: super-fans, shallow engagers, and dormant followers.
-
Track Content Performance:
- Reels attract new followers, while carousels drive engagement.
- Stories reveal your most loyal audience.
-
Use Tools for Deeper Analysis:
- Advanced tools like UpGrow offer real-time tracking and AI-powered targeting.
Regularly review your data to refine your strategy. Use follower insights to tailor content, post at optimal times, and grow an engaged audience.
Understanding Instagram Analytics To Fuel Your Growth (Part 1)
sbb-itb-3c55afb
Setting Up Instagram Insights for Follower Analysis
To analyze your followers using Instagram Insights, you'll need to switch your account to either a Business or Creator profile. The good news? It’s free and takes less than two minutes.
Switching to a Professional Account
Here’s how to make the switch: Open the Instagram app, navigate to your profile, and tap the hamburger menu (the three horizontal lines) in the top-right corner. From there, go to Settings and privacy → Account type and tools → Switch to professional account. You’ll then select a category and choose between a Business or Creator account.
- Business accounts are ideal for brands, retailers, or companies.
- Creator accounts are better suited for influencers, content creators, or public figures.
One important thing to keep in mind: Insights start collecting data only after you switch. Any data from when your account was personal won’t be available. As Nevo David, Founder of Postiz, explains:
"Posting on Instagram without Insights is like driving blindfolded. Sure, you're moving forward, but you have no idea where you're going."
If you’re serious about tracking your progress, it’s a smart move to switch sooner rather than later. Once your account is set up, you’ll be ready to dive into the Insights dashboard.
Navigating Instagram Insights
To access Instagram Insights, tap the Professional Dashboard located below your bio, or use the hamburger menu. The dashboard is organized into three tabs: Overview, Engagement, and Audience, each offering different metrics like share rates and skip rates.
The Audience tab is especially important for understanding your followers. It provides details like:
- Total follower count
- Follower growth (follows and unfollows)
- Top cities and countries
- Age groups (13–17, 18–24, 25–34, and so on)
- Gender distribution
- Peak activity times for your audience
Keep in mind that demographic insights, such as age and location, only become available once you reach 100 followers. Also, Instagram Insights only stores data for the past 90 days. If you want to keep a longer history of your metrics, it’s a good idea to export your data monthly.
Analyzing the Demographics of Your Instagram Followers
Once you’ve set up your Insights dashboard, head over to the Audience tab to dive into detailed follower data. This section gives you a clearer picture of who your followers are and helps refine your strategy.
Understanding Key Demographic Data
Age ranges can shape the tone and style of your content. For example, followers aged 18–24 often engage more with fast-paced Reels and trending formats, while those in the 35–44 range may lean toward practical and informative posts. Similarly, gender distribution is a critical metric. If your audience skews male but your product or service is aimed at women, it’s a sign to rethink your visuals or messaging.
Location data is another goldmine. Instagram highlights your top cities and countries, which can guide your posting schedule to align with your audience’s time zones. If your followers are spread across multiple time zones, posting twice a day might help you reach more of them.
"Founders who read their Insights weekly grow their accounts 2–3x faster than those who post and hope for the best." - Monolit
Keep in mind that Instagram Insights only shows the top 45 cities or countries, so this data reflects your most concentrated audience segments rather than a full global overview.
Identifying Growth Trends by Segment
Once you’ve reviewed your demographic data, focus on the segments fueling your growth. Look for inflection points - moments when growth spikes in a specific age group or location. These could indicate a viral post, a successful collaboration, or even algorithmic shifts.
Seasonal trends are another factor to consider. For instance, fitness accounts often experience a surge in January, while educational accounts may see growth in late summer. If you notice consistent growth from a city or country you hadn’t targeted, this could signal an untapped market. In such cases, consider creating localized content or running ads tailored to that region.
To stay ahead of these shifts, conduct a monthly Instagram audit. This regular check-in helps you spot trends early and adjust your strategy accordingly, ensuring your content stays aligned with your audience’s evolving preferences.
Segmenting Followers by Behavior
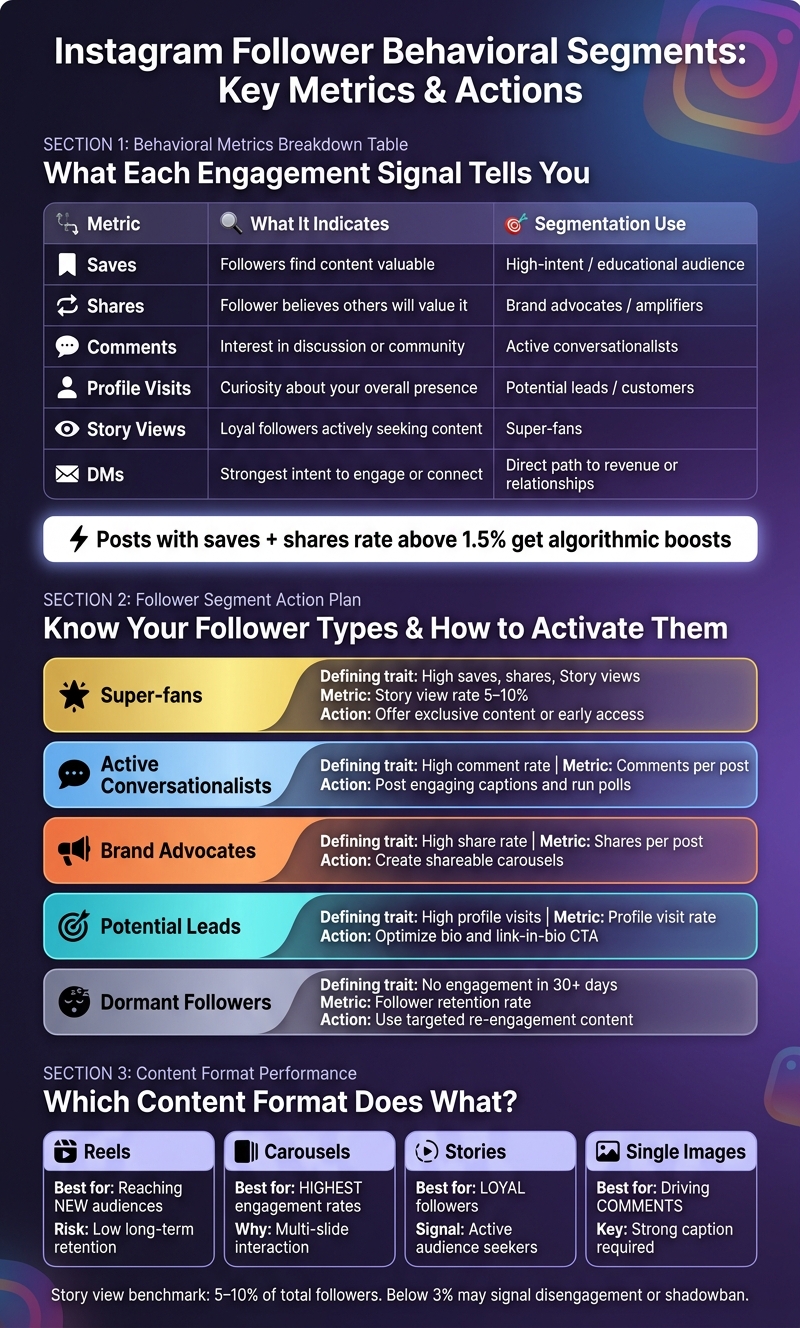
Instagram Follower Behavioral Segments: Metrics & Actions
Demographics tell you who your followers are, but behavioral data reveals how they actually interact with your content. This is where segmentation becomes powerful - because even followers who seem similar can behave in completely different ways. For instance, one person might save every post you share, while another might follow you but never engage again. The key is understanding which engagement signals matter most to tailor your content effectively.
Key Behavioral Metrics to Monitor
As of 2026, Instagram's algorithm places a stronger emphasis on saves and shares rather than likes. Why? Because these actions suggest that your content is either useful or worth sharing with others. Posts with a combined save and share rate above 1.5% are more likely to benefit from algorithmic boosts. On the other hand, likes carry the least weight - they show approval but don’t necessarily indicate deeper engagement.
Here’s a breakdown of what each metric reveals about your audience and how you can use it for segmentation:
| Metric | Indicates | Segmentation Use |
|---|---|---|
| Saves | Followers find the content valuable | "High-intent / educational" audience |
| Shares | Follower believes others will value it | "Brand advocates / amplifiers" |
| Comments | Interest in discussion or community | "Active conversationalists" |
| Profile Visits | Curiosity about your overall presence | "Potential leads / customers" |
| Story Views | Loyal followers actively seeking your content | "Super-fans" |
| DMs | Strongest intent to engage or connect | Direct path to revenue or relationships |
A good benchmark for story views is between 5–10% of your total followers. If your rate dips below 3%, it could signal that your most loyal followers are losing interest - or, in some cases, it might indicate a shadowban.
You can also categorize followers based on how deeply they engage. For instance:
- Super-fans: These followers consistently like, comment, share, and engage with your Stories.
- Shallow engagers: They might occasionally like a post but don’t go beyond that.
- Dormant followers: These are people who haven’t interacted with your content in months.
By identifying these groups, you can customize your approach. For example, reward super-fans with exclusive perks or content, and create re-engagement campaigns for dormant followers.
Analyzing Content Performance by Format
Different types of content spark different kinds of engagement. For example:
- Reels: Great for reaching new audiences and gaining followers, but these followers often don’t stick around long-term.
- Carousels: These tend to generate the highest engagement rates because users interact with multiple slides.
- Stories: These attract your most loyal followers - the ones actively looking for your content.
- Single images: These can drive comments when paired with a strong caption that encourages discussion.
To figure out which formats work best for your audience, use Instagram Insights and the "Content You Shared" feature. This tool allows you to filter posts by format and sort them by metrics like saves or shares. It’s a quick way to see which formats resonate most with specific behavioral segments. From there, you can refine your strategy to focus on the content that drives the most meaningful engagement.
Turning Follower Insights into Action
Transforming follower insights into actionable steps can help fine-tune your content strategy, posting schedule, and audience targeting.
Building a Follower Segmentation Plan
To make the most of your audience data, segment your followers based on their behavior and engagement patterns. Document each group's key traits, the primary metric to track, and the action you plan to take. Here's a simple framework to organize this information:
| Segment | Defining Trait | Primary Metric | Action to Take |
|---|---|---|---|
| Super-fans | High saves, shares, Story views | Story view rate (5–10%) | Offer exclusive content or early access |
| Active conversationalists | High comment rate | Comments per post | Post engaging captions and run polls |
| Brand advocates | High share rate | Shares per post | Create shareable content like carousels |
| Potential leads | High profile visits | Profile visit rate | Optimize your bio and link-in-bio call-to-action |
| Dormant followers | No engagement in 30+ days | Follower retention rate | Use targeted re-engagement content |
Once you've outlined your segments, adjust your posting schedule to align with their activity patterns. For U.S.-based audiences, engagement peaks between 6–9 PM on weekdays.
Tracking your follower retention rate is just as important as monitoring growth. This metric reveals how many followers from specific segments stick around after 30, 60, and 90 days. Focusing on net growth - followers gained minus those lost - gives you a clearer picture of whether your strategy is effective.
"Don't blindly follow the data. Your Instagram follower growth tracker shows correlation, but you must understand causation." - InfluenceFlow
Stay consistent with data collection. Daily tracking helps you spot sudden changes, such as drops in engagement, while weekly reviews allow for more thoughtful adjustments without overreacting to short-term fluctuations.
For more advanced insights, you’ll need tools that go beyond what Instagram Insights provides. That’s where the next section comes in.
Using Tools for Deeper Follower Analytics
Advanced analytics tools can take your segmentation plan to the next level, offering more detailed and real-time insights compared to Instagram’s built-in features.
Take UpGrow, for example. Its live dashboard provides real-time tracking of follower growth, eliminating the typical 12–24 hour delay. Plus, its AI-powered targeting allows you to filter by location, age, gender, and language, ensuring your growth efforts focus on the most valuable audience segments. This level of precision is key to attracting followers who are likely to stick around and engage.
Why does this matter? By 2026, 84% of brands will verify follower quality before entering partnerships, a significant increase from 67% in 2024. With an estimated 13% of Instagram followers worldwide being fake accounts, it’s more important than ever to ensure your growth strategy prioritizes real, organic followers. UpGrow achieves this by filtering out bots, which not only protects your eligibility for brand collaborations but also keeps your engagement rate healthy. For reference, the average Instagram engagement rate across all accounts is projected to be 4.2% in 2026. Creators who actively monitor their metrics tend to earn 34% more from brand partnerships than those who don’t.
No matter which tool you choose, make sure it operates through the official Instagram Graph API. Using tools that bypass this can lead to shadowbans or account suspensions, undoing all the hard work you’ve put into segmentation and strategy.
Conclusion
Analyzing Instagram follower segments is all about following a clear and repeatable process. Start by switching to a professional account, then dive into your demographic data to understand who your followers are. Pair that with behavioral insights - like saves and shares - to uncover what they care about. Together, these two types of data provide a much more complete picture than either could on its own.
Keep in mind, segmentation isn’t a one-and-done task. Your audience and trends will shift over time. For fast-growing brands, it’s worth reviewing your data weekly or at least monthly to stay on top of these changes. Use the insights you gather to fine-tune your strategy - whether it’s adjusting your content mix, tweaking posting times to match peak engagement, or tailoring captions to resonate with specific groups. The key is to tie these changes directly to what your segmentation data reveals, ensuring your approach evolves alongside your audience.
If you’re looking for even deeper insights, tools like UpGrow can help. They offer AI-powered targeting with filters for age, gender, location, and language, along with a live dashboard to monitor real-time growth. It’s a smart way to focus on building a genuine, organic following.
FAQs
What follower segments should I track first?
To get started, keep an eye on key audience metrics like demographics (age, gender, location, interests) and engagement patterns (when they’re most active, what content they interact with, and how they behave as followers). These details give you a clearer picture of your audience, making it easier to create content that resonates. By honing in on these core areas, you can fine-tune your approach and sharpen your targeting.
How do I measure save and share rates?
To track how your content is performing on Instagram, focus on save and share rates. These metrics help you understand how engaging your posts are. Here's how to calculate them:
- Save Rate: Use the formula (Saves ÷ Reach) × 100. This shows what percentage of people who saw your post saved it.
- Share Rate: Apply the formula (Shares ÷ Reach) × 100. This reveals the percentage of viewers who shared your post.
Head over to Instagram Insights to find the number of saves and shares for each post. Plug those numbers into the formulas above to get a clearer picture of how well your content connects with your audience.
How can I spot fake or low-quality followers?
Identifying fake or low-quality Instagram followers is easier if you know what to look for. Start by checking for incomplete profiles, missing profile pictures, or randomly generated usernames - these are often red flags. Accounts with no posts or content can also signal inauthentic followers.
Another clue? Low engagement rates. For smaller accounts, engagement below 1% is a strong indicator of fake followers. Pay attention to comments as well - if they seem generic or spammy, they’re likely not from genuine users. Additionally, if the demographics or locations of followers don’t align with your target audience, that’s another warning sign.
To keep your audience authentic, regularly review your followers. Tools like UpGrow's Fake Follower Checker can make this process easier, helping you maintain a real and engaged community.
%20to%20tailor%20content%20and%20boost%20engagement.&image=https://www.upgrow.com/blog-images/assets.seobotai.com/cdn-cgi/image/quality=75,w=1536,h=1024/upgrow.com/6a124c145ded517781ca9346-1779585963556.jpg)


