Table of contents
- How to Measure Instagram Engagement | Tips & Tutorial
- Step 1: Key Instagram Metrics to Track
- Step 2: How to Access Instagram Insights
- Step 3: How to Calculate Engagement Rate
- Step 4: Analyzing Trends and Comparing Performance
- Step 5: Turning Insights into a Content Strategy
- Conclusion: Using Engagement Metrics to Grow on Instagram
- FAQs
Want better Instagram performance? Start by focusing on engagement metrics. These numbers - likes, comments, shares, saves, and more - go beyond follower counts to show how much your audience interacts with your content. Why does this matter? Posts with strong early engagement are prioritized by the Instagram algorithm, meaning more reach and visibility.
Here’s what you should track:
- Likes: Quick appreciation.
- Comments: Deeper interaction.
- Shares: Expands your audience.
- Saves: Signals lasting value.
Also, monitor reach, impressions, and accounts engaged to understand visibility and interaction levels. Calculate engagement rates using two methods:
- By Followers (ERF): Total interactions ÷ follower count.
- By Reach (ERR): Total interactions ÷ reach.
Smaller accounts often see higher engagement rates. For example, accounts with under 10K followers should aim for 3%-6%.
Use Instagram Insights to access this data. The platform offers tools to analyze trends, compare content formats (e.g., Reels vs. Carousels), and refine your strategy.
Want actionable tips? Prioritize saves, shares, and comments - they carry more weight than likes. Add CTAs like “Save this for later” to boost engagement.
Key takeaway: Engagement metrics are your roadmap to creating content that resonates and grows your Instagram presence.
How to Measure Instagram Engagement | Tips & Tutorial
sbb-itb-3c55afb
Step 1: Key Instagram Metrics to Track
To understand how your Instagram content is performing, it's important to focus on the metrics that actually reflect audience engagement. While Instagram provides a ton of data, not all of it is equally useful. The key is knowing which numbers matter most and how they work together to tell the story of your content's impact.
Likes, Comments, Shares, and Saves
These four actions are the foundation of engagement tracking, and each one tells you something different about how your audience interacts with your posts.
- Likes are the simplest form of engagement, showing that someone appreciated your content at a glance.
- Comments require more effort and signal that your content sparked a reaction or conversation. Instagram's algorithm values comments highly because they show deeper interaction.
- Shares are even more meaningful. When someone shares your post - whether privately or on their Story - they're endorsing it to others, expanding your reach to new audiences.
- Saves might be the most important metric of all in 2026. A save indicates that your content is worth revisiting, which tells Instagram your post has lasting value.
"A post with 50 saves outperforms a post with 500 likes in terms of algorithmic distribution." - Planify Apps
For educational or resource-focused content, aim for about 1 save for every 3–5 likes. Hitting this ratio consistently is a strong sign that your content resonates with your audience.
Reach, Impressions, and Accounts Engaged
These metrics focus on visibility, but each one answers a different question about your content's performance.
| Metric | What It Measures | Why It Matters |
|---|---|---|
| Reach | Unique accounts that saw your content | Shows how far your content traveled |
| Impressions | Total views, including repeat views | Reflects how often your content was seen |
| Accounts Engaged | Unique accounts that took an action | Highlights how many viewers interacted |
Instagram has also updated its terminology, now using "Views" as a unified metric for all content formats, replacing older terms like "plays" and "impressions" for Reels. Make sure you're familiar with these changes when reviewing your Insights.
Follower Growth and Engagement Rate
Tracking your follower count over time can give you a sense of your audience growth, but the engagement rate is what really reveals how well your content connects with your audience. Engagement rate measures the percentage of people who interact with your content compared to how many saw it or follow you.
You can calculate engagement using two common methods:
- ERF (Engagement Rate by Follower): Interactions divided by follower count.
- ERR (Engagement Rate by Reach): Interactions divided by reach.
What qualifies as a "good" engagement rate depends on your account size. Smaller accounts (under 10,000 followers) should aim for 3%–6%, while larger accounts (over 1 million followers) are doing well with rates above 1.5%. The overall average on Instagram in 2026 is just 0.45%, so keep your account's context in mind when interpreting your numbers.
With these metrics in focus, the next step is learning how to pull this data using Instagram Insights.
Step 2: How to Access Instagram Insights
To access Instagram Insights, you'll need a Professional account - either Business or Creator. These accounts are the only ones that provide access to Instagram's analytics tools. If you're not already using a Professional account, switching is simple. Head to your profile, tap the menu icon, select "Settings and privacy", navigate to "Account types and tools", and choose "Switch to professional account". Keep in mind that Insights data starts collecting from the day you make the switch - it doesn’t track past activity.
Navigating the Professional Dashboard
Once your account is set up, you can find Instagram Insights through the Professional Dashboard. On your profile, tap "Professional Dashboard" and then select "Account Insights". Alternatively, you can access it through the three-line menu in the top-right corner of your profile and selecting "Insights".
The dashboard offers four key sections:
- Accounts Reached: Shows the number of reach (the number of unique users who have seen your content), with details on followers versus non-followers.
- Accounts Engaged: Tracks interactions such as likes, comments, saves, and shares.
- Total Followers: Provides growth trends and insights into when your audience is most active - helpful for timing your posts.
- Content You Shared: A summary of all the posts you've published.
Instagram retains account-level metrics for up to 90 days, so all data you see will be filtered within this window.
"You cannot improve what you don't measure. Instagram Insights provides the measurements for free."
- Michael Anderson, Instagram Analytics Specialist, Instatrackr
From here, you can dive deeper into the performance of individual content formats.
Exploring Content Insights
Each type of content on Instagram has its own set of Insights, and here's how to access them:
- Feed Posts: Tap "View Insights" below a post to see metrics like reach, likes, comments, saves, and shares.
- Reels: Open the Reel, tap the three dots (...), and select "Insights". This section includes data like plays, total watch time, and a retention graph that shows when viewers stop watching.
- Stories: Swipe up on an active Story to view real-time metrics such as exits and forward taps. For expired Stories, go to "Content You Shared" in the main Insights dashboard.
- Live Video: Insights for Live sessions can be found under "Content You Shared" and include data like peak concurrent viewers and comments.
For a practical approach, use the "Content You Shared" section to filter posts by Saves or Shares instead of focusing on Likes. This can help you identify which posts your audience finds most useful or engaging. You can also filter metrics by preset timeframes (7, 14, 30, or 90 days) or set a custom range within the 90-day limit.
| Content Type | How to Access Insights | Key Metrics Available |
|---|---|---|
| Feed Posts | Tap "View Insights" below the post | Likes, Comments, Shares, Saves |
| Reels | Tap "..." on the Reel and select "Insights" | Plays, Watch Time, Retention Graph |
| Stories | Swipe up on active Story | Exits, Forward Taps, Replies |
| Live Video | Navigate to "Content You Shared" | Peak Concurrent Viewers, Comments |
Step 3: How to Calculate Engagement Rate
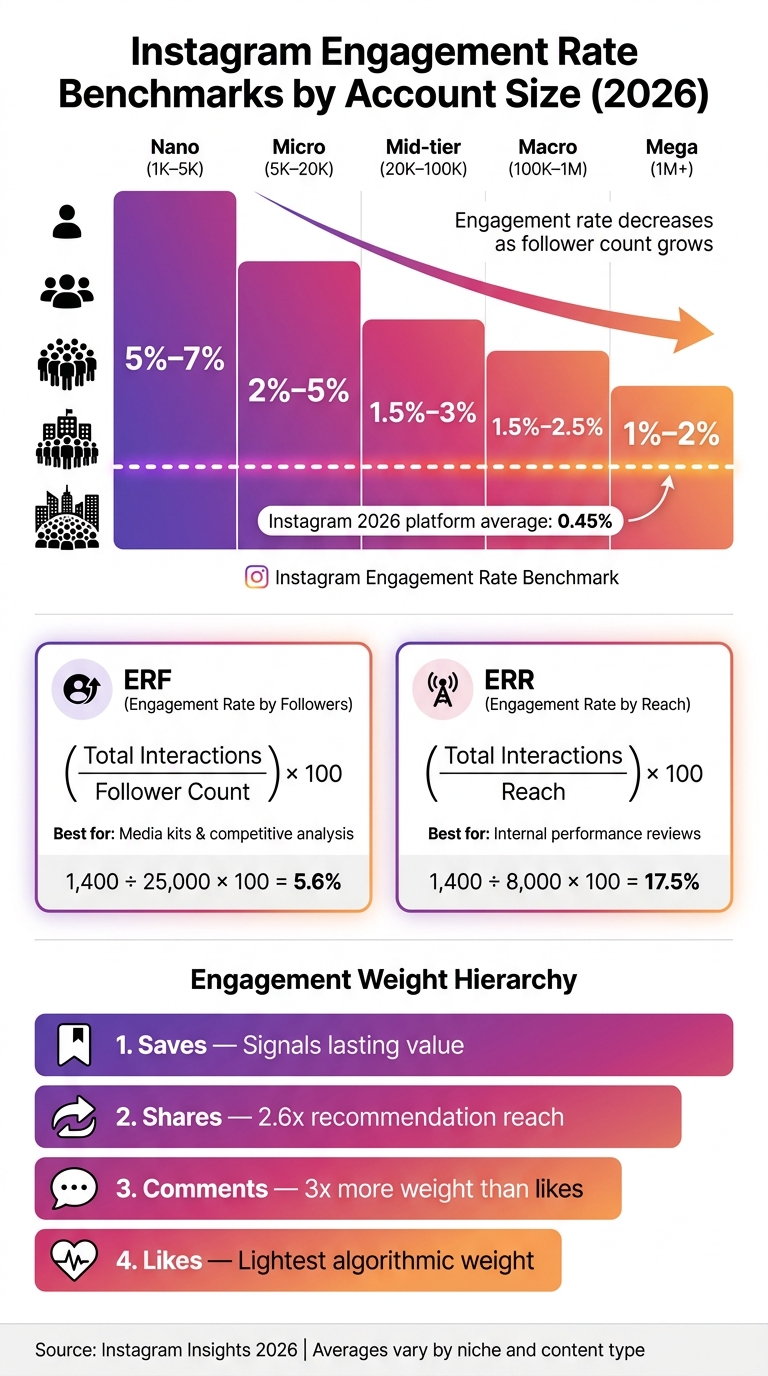
Instagram Engagement Rate Benchmarks by Account Size (2026)
Understanding your metrics is just the first step - calculating the engagement rate is where the real value lies. This gives you actionable insights into how your content is performing. Let’s break down the two main ways to calculate it.
Engagement Rate by Followers
This formula calculates engagement as a percentage of your total followers:
((Likes + Comments + Shares + Saves) ÷ Total Followers) × 100
For example, if you have 25,000 followers and 1,400 total engagements (1,200 likes, 85 comments, 40 shares, and 75 saves), the calculation would be:
(1,400 ÷ 25,000) × 100 = 5.6%
To get a more reliable benchmark, average this rate across your last 30 posts. It's also important to note that engagement rates vary depending on the size of your account. Smaller accounts, like nano accounts (1K–5K followers), tend to see higher engagement rates compared to mega accounts (over 1M followers).
| Account Size | Average Engagement Rate (by Followers) |
|---|---|
| 1K–5K (Nano) | 5%–7% |
| 5K–20K (Micro) | 2%–5% |
| 20K–100K (Mid-tier) | 1.5%–3% |
| 100K–1M (Macro) | 1.5%–2.5% |
| 1M+ (Mega) | 1%–2% |
One drawback of this method is that it includes inactive followers, which can skew the results.
Engagement Rate by Reach
Another approach is to calculate the Engagement Rate by Reach (ERR). This method focuses on the number of unique accounts that actually saw your post:
(Total Engagements ÷ Reach) × 100
This formula gives a more precise view of how well your content resonates with those who interact with it. For instance, if a post reaches 8,000 accounts and receives 1,400 total engagements, the ERR would be:
(1,400 ÷ 8,000) × 100 = 17.5%
Because reach data comes directly from Instagram Insights, this method provides a clearer picture of your content's effectiveness among actual viewers.
"In the era of the content graph, engagement rate has replaced follower count as the primary proxy for reach, for creators, for brands, and most critically, for Instagram's own algorithm." - Searchlight Social
If you're preparing a media kit or doing competitive analysis, stick with Engagement Rate by Followers (ERF), as follower counts are public and easy to compare. On the other hand, for internal performance reviews, the Engagement Rate by Reach (ERR) offers a more accurate measure of how your content is connecting with your audience.
These calculations are essential for identifying content trends, which will be explored in the next step.
Step 4: Analyzing Trends and Comparing Performance
Now that you've nailed down how to calculate engagement rates, it’s time to dig deeper - examining patterns over time to figure out what’s working and what’s not.
How to Spot Trends in Engagement Data
The key to identifying trends is analyzing groups of posts rather than focusing on individual ones. Here’s a simple method: take your last 30 posts, rank them by Engagement Rate by Reach (ERR), and divide them into three groups of 10. Compare the average ERR for each group. If your latest group outperforms the earlier ones, it’s a sign your strategy is heading in the right direction. On the flip side, a decline might indicate a shift - maybe in posting time, content type, or even topic relevance for your business.
Using 30 posts ensures your analysis is reliable. Smaller sample sizes can be skewed by outliers, like a one-time viral hit or an unusually low performer.
When you find a standout post, don’t stop at just noticing it. Use the "Why?" framework: identify five specific reasons the post succeeded. Was it the attention-grabbing hook? A trending audio track? A relatable subject that resonated with your audience? This kind of detailed breakdown turns your observations into actionable insights.
One metric to keep an eye on is saves. Content that gets saved often is reported to receive 40% more future distribution than posts that only rack up likes. If your save rate is climbing, it’s a strong signal that your audience finds your content genuinely helpful - not just eye-catching.
After pinpointing trends, the next step is to evaluate how different content formats are performing.
Comparing Performance Across Content Formats
Understanding how each content format performs is just as important as tracking overall trends. But don’t make the mistake of directly comparing formats like Reels, Carousels, and Stories - they each serve distinct purposes and should be assessed on their own terms.
"The right format strategy is the one supported by your own data – not a platform-level trend." - BrandGhost
Instagram’s Content Insights tab can help you filter by format and compare metrics side by side. To ensure fairness, always use a reach-based engagement rate for comparisons. This avoids misleading conclusions since formats like Reels often reach non-followers, while Stories and feed posts primarily engage your existing audience.
Here’s a quick breakdown of how to evaluate different formats:
| Content Format | Primary Strength | Key Metric to Track |
|---|---|---|
| Reels | Discovery & new audiences | Reach, watch completion rate |
| Carousels | Education & saves | Save rate, engagement rate |
| Stories | Community & retention | Replies, exit rate |
| Single Images | Visual impact & brand awareness | Profile visits, reach |
While platform averages can give you a general idea, your focus should always be on your own account’s data. To find your top-performing format, calculate the average engagement for each type separately, then compare them. Avoid directly benchmarking a Reel against a static image - they serve completely different purposes.
If you’re testing formats, keep your content topic consistent and only vary the format. For example, post a tutorial as a Reel one week and as a Carousel the next. Then compare their ERR. This kind of single-variable testing provides clean, actionable insights.
Step 5: Turning Insights into a Content Strategy
Once you've spotted trends and compared formats, the next step is simple: let your data guide your next moves.
Optimizing Content Based on Top-Performing Metrics
Here's a habit worth picking up: spend 15 minutes every Monday analyzing your top three posts from the previous week. Sort them by reach and saves, then look for patterns. Was it the format, the topic, the hook, or even the time you posted? Over time, these patterns will shape your content strategy.
When it comes to timing, leverage the "Most Active Times" graph in Audience Insights. Schedule your posts 15–30 minutes before your audience's peak activity. This approach allows your content to gain early traction just as traffic begins to surge. Instagram’s algorithm evaluates performance in the first 30–60 minutes, so hitting that sweet spot can significantly expand your reach.
If a post performs exceptionally well, break it down. Examine the topic, the format, the hook (like the first line of text or the opening two seconds of a video), and the call-to-action. For instance, Reels that capture attention within the first two seconds achieve 3.1x higher completion rates compared to those that don’t.
"Founders who read their Insights weekly grow their accounts 2–3x faster than those who post and hope for the best." - Monolit
Prioritizing Saves, Shares, and Comments
Not all engagement metrics are created equal. Saves, shares, and comments carry much more weight than likes when it comes to both the algorithm and understanding your audience.
- Saves indicate that your content has lasting value - people want to revisit it.
- Shares signal that your content resonates enough for someone to pass it along, which is a powerful way to reach new audiences. Posts with high shares-to-likes ratios enjoy 2.6x the recommendation reach compared to posts with lots of likes but few shares.
- Comments are particularly influential, as they require effort. The algorithm values comments 3x more than likes.
Here’s how these metrics can guide your content creation:
| Metric | What It Tells You | Best Response |
|---|---|---|
| Saves | Content has long-term value | Create more educational carousels or how-to posts |
| Shares | Content is relatable or surprising | Focus on short Reels (under 60 seconds) |
| Comments | Content sparks conversation | Conclude captions with open-ended questions |
| Profile Visits | Hook is driving follower intent | Reuse that hook style in future posts |
Small adjustments can make a big difference. For example, adding a "Save this for later" call-to-action (CTA) in your caption can boost save rates by up to 67%. Similarly, ending captions with thought-provoking questions - not simple yes/no ones - can increase comment rates by 34%. These tweaks don’t require heavy production work; they’re quick, impactful copy changes that can elevate your content’s performance.
Conclusion: Using Engagement Metrics to Grow on Instagram
Tracking Instagram engagement metrics is like having a roadmap for growth. By regularly reviewing metrics, using Instagram Insights, calculating engagement rates, spotting trends, and adjusting your content strategy, you can take the guesswork out of growing your presence. These tools give you the data to make smarter decisions - turning analysis into action that drives results.
FAQs
Which engagement rate should I use - by followers or by reach?
When deciding which engagement rate to use, it really comes down to your goal. Engagement rate by followers gives you a quick snapshot of your audience's overall health and is useful for comparing against industry benchmarks. On the other hand, engagement rate by reach helps you evaluate the impact and quality of a specific post. This metric focuses on how engaging your content was to the unique people who actually viewed it.
What counts as a “good” engagement rate for my account size?
Engagement rates can differ based on the size of an account's following since larger audiences often see lower percentages. For accounts with fewer than 10,000 followers, an engagement rate between 3% and 6% is considered strong. Accounts with 10,000 to 100,000 followers typically see rates around 2% to 4%, while those with more than 100,000 followers usually fall between 1% and 2.5%. These benchmarks are helpful, but the real key is to monitor your own engagement trends closely. This allows you to refine your strategy and encourage organic growth effectively with tools like UpGrow.
How can I improve saves and shares without changing my content?
To get more saves and shares without changing your content, focus on improving your captions and calls to action. For example, encourage viewers to share your post by asking them to tag a specific person - like a friend who might find it helpful. This small tweak can lead to a noticeable rise in shares.
When it comes to saves, emphasize the practical value of your post. Frame it as something useful, like a guide or cheat sheet, to make it clear why someone would want to revisit it later. Finish with a strong, shareable statement that not only invites engagement but also signals value to the platform's algorithm.