The Instagram Insights API gives businesses and creators access to data from Instagram professional accounts. It tracks metrics like reach, engagement, follower trends, and audience demographics. Here’s why it matters:
- Who Can Use It: Only available for Business and Creator accounts. Requires a Meta developer account and app registration. Since July 2024, accounts no longer need to link to a Facebook Page.
- Key Metrics: Includes reach, views, follower growth, interactions, and audience demographics. Media-specific metrics cover Feed posts, Reels, and Stories.
- Real-Time Monitoring: Webhooks and efficient API usage help track performance without hitting rate limits.
- Cross-Platform Reporting: Data integrates with tools like Google Analytics and CRMs to align Instagram performance with broader marketing efforts.
- Limitations: Metrics like demographics require at least 100 followers. Data retention is limited to 90 days for user metrics and 2 years for media metrics.
This API streamlines data collection, enabling smarter Instagram strategies and better integration with other platforms.
Instagram Graph API Insights with Python
sbb-itb-3c55afb
Key Features of the Instagram Insights API
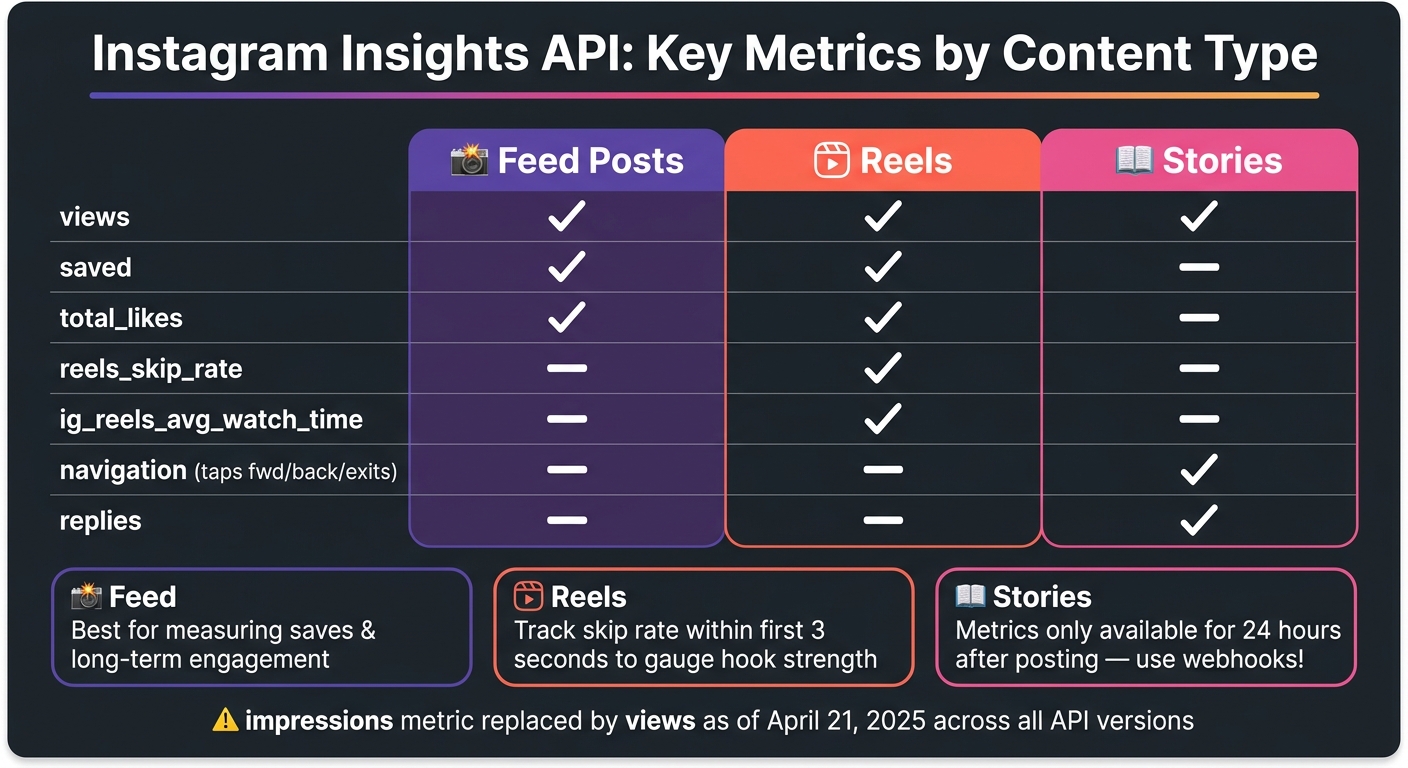
Instagram Insights API: Media Metrics by Content Type
Account-Level Metrics
The Instagram Insights API provides a snapshot of your account's overall performance. It includes key metrics like:
reach: The number of unique accounts that viewed your content.views: How many times your content was displayed or played.accounts_engaged: The unique accounts that interacted with your posts.total_interactions: A combined count of likes, saves, comments, shares, and replies.
Another useful metric is follows_and_unfollows, which tracks net audience growth over time - helpful for measuring the impact of campaigns. For business accounts, profile_links_taps measures high-value actions, such as tapping call, email, text, or directions buttons. This metric helps gauge how Instagram activity translates into offline interest.
It’s worth noting that follower_count and online_followers are only accessible for accounts with at least 100 followers. Additionally, as of April 21, 2025, the impressions metric has been replaced by views across all API versions. Keep in mind that data updates can take up to 48 hours to appear.
While these metrics provide an account-wide overview, the API also offers detailed Instagram analytics at the content level.
Media-Level Metrics
The API breaks down content performance for Feed posts, Reels, and Stories, each with its unique engagement metrics:
- Feed posts: Metrics like
likes,comments,shares, andsavesapply here, withsavedshowing how often users save posts for later. - Reels: Includes retention-focused metrics like
reels_skip_rate(percentage of viewers skipping within 3 seconds) andig_reels_avg_watch_time(average watch time). These help measure how engaging your Reels are. - Stories: Tracks user interactions with
navigationmetrics, such as taps forward, taps back, and exits. A high number oftap_backactions often indicates viewers found something worth revisiting.
| Metric | Feed | Reels | Stories | Key Insights |
|---|---|---|---|---|
views |
✓ | ✓ | ✓ | Total times content was played or displayed |
saved |
✓ | ✓ | - | Number of users saving the post for later |
reels_skip_rate |
- | ✓ | - | Percentage of skips within the first 3 seconds |
navigation |
- | - | ✓ | Tracks taps forward, back, and exits |
total_likes |
✓ | ✓ | - | Likes across Instagram, Facebook, and Ads |
Story metrics are especially time-sensitive, as they’re typically only available for 24 hours after posting.
Beyond content performance, understanding your audience is crucial.
Audience Demographics and Behavior
Demographic data helps refine your strategy by providing insights into who your followers are and how they engage with your content. Through the /insights endpoint, you can access metrics like:
audience_gender_ageaudience_cityaudience_countryaudience_locale
These metrics differentiate between your follower demographics (those who follow you) and engaged audience demographics (those who interact with your content). Comparing these datasets can reveal whether your content resonates with your existing followers or attracts a new audience. For brands, this data can also verify whether an influencer’s audience aligns with their target market.
However, there are some limitations. Results are capped at the top 45 segments per metric (e.g., the top 45 cities), and demographic data is only available for accounts meeting the 100-follower threshold. Globally, Instagram’s audience skews younger, with around 60% under 35 years old and 31.7% in the 18–24 age range.
These metrics provide the foundation for data-driven strategies and help integrate insights across platforms.
Real-Time Growth Monitoring with the Instagram Insights API
Building Real-Time Dashboards
Keeping tabs on Instagram performance is easier with tools like the GET /{ig-user-id}/insights endpoint, which provides metrics such as follower_count and reach. However, for a more efficient approach, webhooks can be used to receive instant updates on key events like comments, mentions, and story interactions.
Webhooks are especially useful for dashboards, as they help avoid hitting the API rate limit of 200 calls per hour per account. By subscribing to topics such as story_insights, comments, and mentions, you can capture critical data without overloading your system. This is particularly important for ephemeral content like Stories, which disappear after 24 hours.
To further optimize your API usage, you can use field expansion (e.g., ?fields=id,caption,insights.metric(reach)) to pull multiple data points in a single request. Pairing this with caching for metrics that don’t update frequently, like follower count, helps you stay within the rate limits while maintaining a responsive dashboard.
These strategies enable you to monitor performance in real time, laying the groundwork for smarter growth tracking, as discussed in the next section.
Practical Applications for Growth Tracking
Real-time dashboards turn raw Instagram data into actionable insights. For example, tracking metrics like follows_and_unfollows daily can help you link audience changes to specific posts or campaigns. If a particular Reel triggers a surge in followers, it’s a clear signal to focus on similar content.
A key metric to watch is engagement rate, calculated as (total_interactions / follower_count) * 100. Unlike follower count alone, this metric provides a more accurate snapshot of your account’s health over time. Additionally, analyzing the follower_type breakdown within the views metric helps you understand whether your reach is primarily from loyal followers or new audiences.
For Stories, metrics like taps_back, exits, and replies offer insights into viewer behavior. For instance, a high exits rate on a specific slide might indicate that the content isn’t resonating and needs adjustment.
How UpGrow Uses Instagram Insights
UpGrow takes these real-time monitoring techniques a step further with its live analytics dashboard. Powered by the Instagram Insights API, their platform simplifies growth tracking and audience analysis. By leveraging Instagram demographics - such as age, gender, location, and language - UpGrow’s AI-targeting engine continuously refines audience targeting.
Instead of requiring users to sift through raw API data, UpGrow highlights the most impactful metrics, like engagement rates, follower growth trends, and audience composition. Its Boost™ tool uses these insights to identify high-opportunity moments, ensuring that performance changes are addressed quickly. For agencies managing multiple accounts, this integrated solution removes the hassle of building and maintaining separate dashboards, streamlining the entire process.
Using the Instagram Insights API for Cross-Platform Analytics
Combining Instagram Insights with Other Platforms
Now that we've covered real-time monitoring, let’s dive into how Instagram data can integrate with other platforms to create a fuller analytics picture. By merging Instagram Insights with marketing data from other tools, you can unlock a more cohesive view of performance across channels. The API delivers data in JSON format, making it easy to integrate with platforms like BigQuery, Snowflake, or Redshift. This allows you to combine Instagram metrics with data from tools like Google Analytics 4, Google Ads, or your CRM.
For example, you can map profile_links_taps directly to CRM events to track leads or bookings. Using the Facebook Login API, you can access total_* metrics, such as total_likes and total_views, which consolidate organic and paid engagement. This gives you a clearer understanding of how paid efforts perform compared to organic activity across platforms.
Key Use Cases for Cross-Platform Reporting
Cross-platform reporting focuses on areas like funnel analysis, audience alignment, and campaign comparisons. A common Instagram funnel might track reach → profile_visits → external website clicks. By connecting this data with GA4 session metrics, you can pinpoint where users drop off at each stage.
For audience alignment, metrics like follower_demographics and engaged_audience_demographics provide insights into age, gender, city, and country, which you can use to compare Instagram influencers and their audience quality. These data points can be used to mirror audience targeting in Google Ads or Meta Ads Manager, ensuring your campaigns remain consistent across platforms. The table below highlights how specific Instagram API metrics can be applied to cross-platform reporting:
| Metric Category | Key API Metrics | Cross-Platform Use Case |
|---|---|---|
| Conversion | profile_links_taps, profile_activity |
Measure social ROI by linking to CRM or booking systems |
| Audience | follower_demographics, engaged_audience_demographics |
Maintain consistent targeting in Google Ads or Meta Ads Manager |
| Engagement | total_interactions, total_views |
Benchmark organic social engagement against email or web performance |
| Growth | follows_and_unfollows, reach |
Link follower growth to cross-channel campaigns |
These strategies enable automated reporting, making it easier to leverage the Instagram API for actionable insights across platforms.
Best Practices for Data Modeling and Reporting
To ensure reliable cross-platform reporting, follow these best practices. Normalize UTC timestamps to your local timezone (MM/DD/YYYY) and account for the potential 48-hour delay in metrics. Dashboards labeled as "real-time" should clearly communicate this lag to avoid confusion. Be mindful of data retention limits - user-level metrics are only available for 90 days, while media-level metrics can be retained for up to 2 years. Without an automated pipeline to archive data in a warehouse, long-term comparisons, like year-over-year performance, won’t be possible. Additionally, remember that reach is non-aggregatable - it’s an estimate valid only for specific time frames (like 1-day, 7-day, or 28-day) and cannot be summed across dates without skewing results.
"For most teams, full automation strikes the best balance between speed, reliability, and effort - saving time and reducing reporting overhead. That's how you can save up to 40 hours per week, equivalent to a full-time analyst, by eliminating manual CSV exports and App Script maintenance." - Matthias Kraaz, COO, Windsor.ai
Governance, Compliance, and Data Reliability
Following Meta's Platform Policies
When using the Instagram Insights API, you need to stick closely to Meta's compliance rules. Here's how it works: apps start with Standard Access, which only allows data collection for accounts owned by the developer. If you want to access data for other businesses, you'll need Advanced Access. This requires completing both Meta App Review and Business Verification.
Permissions are another key piece of the puzzle. If you're accessing insights via Facebook Login, you'll need instagram_manage_insights and instagram_basic. On the other hand, Instagram Login requires instagram_business_manage_insights. Missing the right permissions can lead to API errors and interruptions.
Rate limits are not fixed; they adjust dynamically. Meta calculates them using a rolling 24-hour formula: 4,800 × number of impressions. Accounts with higher traffic get higher limits, while smaller accounts may hit their cap sooner. To avoid disruptions, keep an eye on the X-App-Usage and X-Business-Use-Case-Usage response headers. These will help you spot potential 403 errors before they impact your workflow.
One more thing: if your app uses automated messaging for California users, you must disclose that they're interacting with a bot right at the start of the conversation.
Keeping Data Accurate and Consistent
The Instagram Insights API has a few quirks that can affect your reporting. Following these practices will help you maintain both compliance and consistency in your data.
First, avoid using data from the most recent 48 hours in your final reports. There's often a delay, and recalculations can lead to empty data sets during this period. It's also important to treat empty data sets as distinct from zero values. This prevents you from misinterpreting trends.
Story metrics are another area to watch closely. They're only available for 24 hours unless the story is saved as a highlight or captured using a story_insights webhook. Without webhooks, you'll miss out on metrics beyond that 24-hour window.
Make sure your pipelines are up to date with the latest metrics. Many older metrics have been replaced. Here's a quick reference:
| Deprecated Metric | Recommended Replacement |
|---|---|
impressions |
views |
plays (Reels) |
views |
clips_replays_count |
views |
video_views |
views |
Lastly, don't forget to follow U.S.-specific standards for localization in your reporting.
U.S.-Specific Reporting Standards
The API provides timestamps in UTC with ISO-8601 formatting (e.g., 2022-08-01T07:00:00+0000). For U.S. audiences, convert these timestamps to the appropriate local time zones - EST, CST, PST - and reformat dates to MM/DD/YYYY before including them in dashboards or reports.
Currency values are delivered as raw integers. If you're displaying revenue or ad spend data, make sure to format these as USD (e.g., $1,250.00) before presenting them to stakeholders. The API won't handle this formatting for you.
For regulated ad campaigns - like those in housing, employment, or credit - you need to take extra steps. Use the is_eligible_for_sac_campaigns field to identify eligible audiences and ensure compliance with Meta's Special Ad Category rules. Skipping this step could result in unexpected campaign pauses. These rules are not optional; they're mandatory for regulated categories.
Conclusion and Key Takeaways
Final Thoughts on the Instagram Insights API
The Instagram Insights API offers businesses a powerful way to drive growth by simplifying data collection across multiple accounts, creating custom dashboards, and integrating performance metrics into tools like HubSpot or other BI platforms. With media-level metrics - such as Reels skip rates and Story tap-forward counts - it becomes easier to pinpoint where audience engagement drops off. Additionally, audience demographic data (available for accounts with at least 100 followers) allows content to be tailored by age, gender, and location. Importantly, Meta has streamlined all view-based metrics under a unified "views" standard, replacing older terms like "impressions" and "plays". These features not only enable detailed content performance metrics analysis but also support real-time monitoring and tracking growth across platforms. This makes the API a key tool for turning raw data into actionable strategies.
"We've added User and Media Insights to help people understand their content performance and inform their content creation strategy on Instagram." - Shravya Garlapati, Meta for Developers
How UpGrow Can Help You Grow on Instagram
Data analysis is only as valuable as the actions it inspires. That’s where UpGrow steps in, using AI-powered targeting to help brands grow their Instagram presence. By filtering audiences based on location, age, gender, and language, UpGrow ensures organic follower growth without relying on bots or fake accounts.
Their live analytics dashboard provides real-time updates on your progress, so you can see exactly how your strategy is performing. When combined with the Instagram Insights API, this approach gives brands a practical framework for achieving measurable growth. Plans start at $39/month, and every plan includes a growth guarantee - grow your followers or get your money back.
FAQs
What do I need to access the Instagram Insights API?
To use the Instagram Insights API, you'll need a few essentials. First, ensure you have an Instagram professional account, either a Business or Creator account. Next, register for a Meta Developer account and set up a Facebook App through the Meta Developer Dashboard.
You'll also need a valid user access token with permissions such as instagram_business_manage_insights or instagram_manage_insights. Depending on your setup, you might also need to configure Meta login and maintain a webhooks server to handle notifications effectively.
How can I track Instagram Insights in near real time without hitting rate limits?
To keep tabs on Instagram Insights efficiently, it's essential to work within the 200 API calls per user per hour limit. Keep in mind that updates to the data can take up to 48 hours, which means real-time tracking isn't always possible. To stay on top of specific changes, like story insights, consider using webhooks. Additionally, schedule API requests during off-peak hours to make the most of your call allowance. Finally, store the retrieved data in a database to build a historical record, as the API only provides a limited window for past data.
How do I combine Instagram Insights data with GA4 or my CRM?
To connect Instagram Insights with tools like Google Analytics 4 (GA4) or your CRM, the Instagram Graph API is your go-to resource. By using the GET /account-id/insights endpoint along with a user access token, you can programmatically pull data.
For seamless automation, developers frequently rely on integration tools to sync Instagram data with CRM or analytics platforms. Tools like UpGrow make this process easier by offering real-time performance analytics and a live dashboard, helping refine growth strategies effectively.