Table of contents
Want to grow your Instagram effectively? Instagram growth dashboards are your go-to tool for tracking and improving performance. They consolidate key metrics like follower growth, engagement, and content performance into one place, making it easier to understand what works and why.
Here’s what you’ll learn:
- How growth dashboards differ from Instagram Insights.
- Why tracking metrics like saves, shares, and follower retention matters in 2026.
- How tools like UpGrow use AI to boost follower growth by up to 275%.
- Steps to set up your own dashboard and connect data sources like Google Analytics or Shopify.
Quick takeaway: Growth dashboards don’t just track numbers - they help you make smarter decisions by turning data into actionable insights.
4 Instagram Growth Metrics every business needs ( Analytics Guide )
sbb-itb-3c55afb
Key Metrics to Track for Instagram Growth
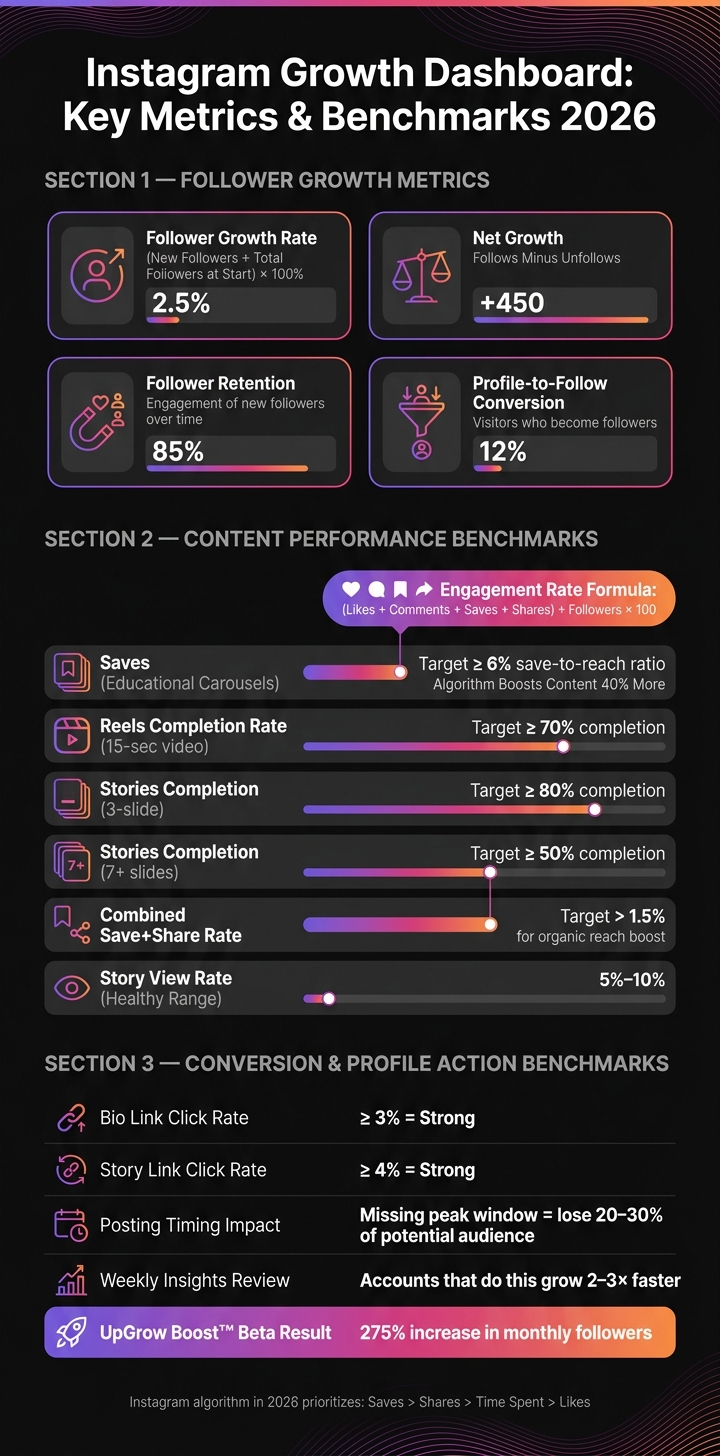
Instagram Growth Dashboard: Key Metrics & Benchmarks 2026
Once your dashboard is set up, it’s time to focus on the metrics that genuinely drive Instagram growth. Not all metrics are equally important - especially in 2026, when Instagram’s algorithm prioritizes saves, shares, and time spent over simple likes. If you’re tracking the wrong numbers, you might feel like you’re making progress while your growth actually stalls. Tools like UpGrow’s real-time dashboards can help you zero in on the data that truly matters.
Follower Growth Metrics
A high follower count might look impressive, but it’s not the best measure of success. Instead, pay attention to your follower growth rate - calculated as (new followers ÷ total followers at the start of a period) × 100%. This metric shows how quickly your account is gaining momentum, which is a better indicator of account health than raw numbers.
You’ll also want to track net growth (follows minus unfollows) to see if your audience is sticking around, and follower retention to measure how well you’re engaging new followers over time. Keep an eye on follower quality too - accounts with random-character handles, no profile pictures, or an unusually high following count (like 7,000+) but zero followers are often bots or fake profiles.
| Metric | What It Tells You |
|---|---|
| Follower Growth Rate (%) | How quickly your audience is expanding |
| Net Growth | The balance between new followers and those who leave |
| Follower Retention | Whether new followers stay engaged over time |
| Profile-to-Follow Conversion Rate | How many visitors to your profile actually follow you |
By using tools like UpGrow, you can track these metrics in real time and make smarter decisions about how to grow your audience. Once you’ve got a handle on your follower trends, the next step is to analyze how your content is performing.
Content Performance Metrics
Understanding your audience is only half the battle - you also need to know if your content is hitting the mark. In 2026, Instagram’s algorithm heavily favors saves over other engagement types. In fact, content that gets saved sees 40% more future distribution compared to posts that only earn likes. Aim for a 6%+ save-to-reach ratio on educational carousel posts.
For Reels, focus on the completion rate. A 15-second video should achieve at least 70% completion to get a boost from the algorithm. When it comes to Stories, aim for 80% completion on a 3-slide sequence, and at least 50% completion for sequences with 7 or more slides. To measure overall engagement, use this formula: (Likes + Comments + Saves + Shares) ÷ Followers × 100. This gives you a clear picture of how well your content is performing.
Using UpGrow’s dashboard, you can track these metrics as they happen, allowing you to adjust your strategy immediately instead of waiting for weekly reports.
"Track quality, not just quantity: Follower count matters less than engagement rate and follower authenticity." - InfluenceFlow
Conversions and Profile Actions
Engagement is important, but it should lead to action. Metrics like link clicks, profile visits, and click-through rates (CTR) bridge the gap between social activity and your business goals. A bio link click rate of 3%+ is considered strong, while story link clicks should aim for 4%+.
To track these actions accurately, always use UTM parameters for your bio and story links. This allows you to pinpoint which posts or campaigns are driving website visits, sign-ups, or sales. For brands and creators, this data is crucial - it not only helps justify partnership rates but also shows the return on investment for your efforts. With UpGrow, you can monitor these conversion metrics alongside your follower and engagement data, all in one place.
"The dashboard is our source of truth for CAC and is a key tool in helping us plan our marketing strategy." - Hooman Radfar, Co-founder and CEO, Collective
How to Set Up an Instagram Growth Dashboard
Tracking the right metrics is crucial, but they’re only useful when consolidated into a single, easy-to-access dashboard. Setting up this dashboard is simple, but skipping key steps can lead to incomplete or unreliable analytics down the line.
What You Need Before Getting Started
First, ensure your Instagram account is set to Business or Creator mode. Without this, you won’t have access to professional insights or the API permissions needed to pull data into a dashboard. These permissions include instagram_business_manage_insights, instagram_basic, and pages_read_engagement - all essential for accessing detailed analytics through tools powered by AI.
Keep in mind a few limitations:
- Accounts with fewer than 100 followers can’t access certain metrics, such as follower count or online follower data.
- Instagram’s native analytics only retains historical data for 30–90 days. Connecting a dashboard sooner ensures you’ll capture more data over time.
Once your account is ready, the next step is to integrate other data sources for a more comprehensive view of your growth.
Connecting Data Sources
Instagram data alone doesn’t provide the full picture. Combining it with platforms like Facebook Ads, Google Analytics 4, or Shopify lets you see how your social media efforts contribute to broader business outcomes.
Here are three ways to pull Instagram data into a dashboard:
| Method | Setup Effort | Data Freshness | Best For |
|---|---|---|---|
| Automated Connector | Very easy | Hourly or daily | Most teams |
| Manual Export (Google Sheets) | Moderate | Static | Small accounts |
| Instagram Graph API | High (developer required) | Near-real-time | Technical teams |
For most teams, automated connectors are the go-to option. They’re quick to set up and require minimal maintenance. As Matthias Kraaz, COO at Windsor.ai, explains:
"For most teams, full automation strikes the best balance between speed, reliability, and effort - saving time and reducing reporting overhead. That's how you can save up to 40 hours per week, equivalent to a full-time analyst, by eliminating manual CSV exports and App Script maintenance."
If you choose the API route, remember to monitor token expiration, as expired tokens can stop your data from updating. Also, note that starting April 21, 2025, Instagram will replace the impressions metric with views - be sure to adjust your configurations accordingly.
For teams looking to avoid technical complexities, there’s an easier option.
Using UpGrow to Simplify Setup
Platforms like UpGrow remove the technical hurdles of dashboard setup. Through official API-based integration, you can connect your account without needing to share your password. UpGrow provides a real-time dashboard that tracks Instagram growth strategies and metrics around the clock.
Instead of manually configuring data fields, you can use AI-driven targeting filters to tailor your dashboard to your audience. These filters cover key parameters like location, age, gender, language, interests, and hashtags. For agencies or teams managing multiple accounts, UpGrow supports centralized management and offers bulk-discount options. Plus, automated PDF reports and weekly performance summaries ensure you’re always ready to present results to clients or stakeholders without digging through raw data.
Using Dashboard Data to Drive Instagram Growth
Building on your dashboard setup, these strategies turn raw data into practical steps for growing your Instagram account.
How to Identify Growth Trends
Rather than focusing solely on your raw follower count, pay attention to net follower change - the difference between followers gained and lost. This gives a clearer picture of your account's overall health.
Another key metric is follower growth velocity, which tracks how quickly your account is growing week by week. Steady, consistent growth typically signals a healthy account. On the other hand, a sudden spike followed by a sharp drop might indicate bot activity or a fleeting viral moment that didn’t lead to long-term engagement. Since Instagram metrics often take 48–72 hours to stabilize, it’s better to review your data weekly instead of daily.
Keep an eye on your story view rate as an early indicator of issues. A healthy rate usually falls between 5% and 10%. If story views suddenly drop, it could hint at a shadowban before it becomes evident in your feed reach. If you notice declining story views, little to no net follower growth, and a 30–50% drop in reach, it’s time to adjust your content strategy to address potential distribution problems.
Once you’ve identified these trends, the next step is using them to refine your content strategy.
How to Improve Content Performance
Focus on posts that drive saves and shares, rather than just likes. As of 2026, Instagram’s algorithm prioritizes saves and shares, so aim for a combined save+share rate above 1.5% to boost your organic reach. This ties back to the save-to-reach and engagement metrics discussed earlier, showing how tracking and action go hand in hand.
When a post performs particularly well, dig into the details: What topic did it cover? Was it a carousel, Reel, or single image? Did the opening hook or call-to-action play a role? Creators who analyze their insights weekly tend to grow their accounts 2–3 times faster than those who don’t.
Timing also matters. Posting within 30 minutes of peak activity can maximize your reach - missing this window might cost you 20–30% of your potential audience. Use your dashboard’s audience activity data to pinpoint the best times to post.
For Stories, monitor user behavior. A high exit rate on specific slides can highlight content that isn’t resonating, giving you a chance to tweak your approach. Conversely, a high "taps back" rate signals content that’s worth repeating.
Using UpGrow's Real-Time Insights
By integrating these strategies, UpGrow helps you act quickly on emerging trends. Its real-time dashboard continuously tracks follower growth and engagement metrics, allowing you to address issues - like a sudden drop in reach or shifts in audience demographics - within hours instead of days.
UpGrow’s AI-powered targeting filters sync directly with your dashboard data. For example, if your analytics reveal that followers from a particular location or age group are engaging more, you can adjust your targeting to attract similar users. Beta testers of UpGrow’s Boost™ feature, which uses pattern recognition to enhance growth strategies, reported a 275% increase in monthly followers. These results come from acting on actual data, not guesswork.
Advanced Features of AI-Powered Growth Dashboards
AI-Driven Insights for Smarter Growth Decisions
Traditional dashboards are great for showing past performance, but AI-powered dashboards take it a step further by actively spotting trends, flagging unusual activity, and even suggesting what to do next.
Take automated anomaly detection, for example. These dashboards constantly monitor your metrics. If a Reel suddenly performs twice as well as usual, or if engagement dips by more than 25% compared to your 30-day average, you’ll get an alert. This means you can act fast - no need to comb through the data yourself.
Another game-changer is the shift from descriptive to predictive analytics. AI dashboards can forecast growth over the next week or month by analyzing historical posting habits, audience behavior, and past content performance. For instance, they might suggest increasing your Reel frequency before launching a campaign. Keep in mind, though, these forecasts are meant to guide your strategy, not guarantee specific outcomes.
Then there’s AI-driven content scoring, which evaluates what works best. If short, educational Reels are a hit with your 25–34 audience, the dashboard will recommend doubling down on that format. This kind of precision is hard to achieve with manual analysis, especially in real time.
On top of these insights, integrating data from other platforms can provide an even clearer picture of your growth strategy.
Cross-Platform Data Integration
Looking at Instagram metrics alone doesn’t tell the whole story. A post might not rack up likes but could still drive website traffic, sign-ups, or even sales. That’s where cross-platform integration comes in.
By connecting your Instagram dashboard to tools like Google Analytics, Shopify, or your CRM, you can track the entire customer journey: from someone watching your Reel to visiting your profile, clicking your bio link, browsing your website, and making a purchase. This approach lets you measure real business outcomes, not just Instagram engagement. For businesses in the U.S., this means tying results directly to revenue in dollars and aligning them with campaign budgets - making it easier to show value to stakeholders.
Automation tools like Zapier or Make.com take it a step further by triggering actions like CRM updates, email campaigns, or Slack notifications when key milestones are hit. This transforms your dashboard from a passive reporting tool into an active part of your marketing strategy.
| Integration Type | Example Platforms | What It Unlocks |
|---|---|---|
| E-commerce | Shopify, WooCommerce | Connect follower growth to actual sales and revenue |
| Web Analytics | Google Analytics | Monitor Instagram-driven traffic and conversions |
| Automation | Zapier, Make.com | Automate workflows based on growth events |
| Social Management | Hootsuite, Buffer, Later | Centralize scheduling and performance tracking |
How UpGrow's AI Tools Support Growth
Building on these features, UpGrow combines analytics with actionable strategies, offering a seamless experience for growth-focused users.
Its Smart Auto-Targeting feature refines audience targeting based on location, age, gender, language, and interests. What’s more, these filters update dynamically as your audience evolves, so you’re not stuck with static settings.
The Viral Content Library tackles one of the biggest challenges: choosing the best Instagram growth tool and deciding what to post. Instead of starting from scratch, you can explore trending templates and high-performing content ideas tailored to your niche. This not only saves time but also boosts the chances of your posts gaining traction.
UpGrow’s Boost™ feature ties everything together. Using pattern recognition, it identifies growth opportunities and scales your efforts to maximize results. For example, beta users saw a 275% increase in monthly followers by combining precise targeting with data-driven content strategies . With 24/7 growth tracking and API-level compliance with Instagram’s rules, UpGrow ensures your growth remains steady and aligned with platform guidelines.
These tools highlight how AI-powered dashboards can simplify decision-making and deliver measurable results in real time. By integrating insights, automation, and strategy, platforms like UpGrow help businesses achieve smarter, faster growth.
Key Takeaways for Instagram Growth Dashboards
The true power of a growth dashboard lies in its ability to track key metrics that matter most. These include follower growth, reach, engagement rate, saves, shares, profile visits, and link clicks. These numbers should be front and center, while other metrics take a backseat. What sets a good dashboard apart is its connection to specific business goals - whether it's increasing brand awareness, generating leads, or driving revenue in USD. Without that connection, dashboards can feel cluttered and lack direction.
Beyond tracking individual numbers, the real magic happens when you start analyzing trends over time. A consistent test-and-learn approach ensures your strategy is grounded in long-term performance rather than one-off wins. For example, you can compare data week-over-week or month-over-month, form a hypothesis based on what the dashboard reveals, and run a targeted 2–4 week content experiment. Measure the results, and if something works, scale it up. Let’s say your dashboard shows that before-and-after Reels consistently get three times more saves than static posts. That’s a clear signal to double down on Reels - not an excuse to post more content without purpose. This iterative process naturally integrates Instagram data into your broader business strategy.
The game changes when you connect your Instagram data with tools like website analytics and CRM systems. This integration shifts your dashboard’s focus from simply tracking activity to delivering measurable business results. It transforms your social dashboard into a growth engine that directly impacts your bottom line.
A unified dashboard doesn’t just monitor growth - it drives decisions. Platforms like UpGrow embody this approach, combining real-time follower tracking, AI-driven targeting, and actionable content insights into one tool. With features like Boost™ and Smart Auto-Targeting, you can respond to your dashboard's insights immediately, instead of waiting for your next review cycle. The result? Measurable growth for those who leverage their data effectively.
FAQs
Which Instagram metrics matter most for growth in 2026?
To stay ahead in 2026, it’s all about prioritizing metrics that show real engagement rather than chasing surface-level numbers. Saves and shares are especially important since algorithms favor these interactions the most.
Here are the key metrics to keep an eye on:
- Engagement Rate by Reach: This is calculated as (Likes + Comments + Saves + Shares) / Reach × 100. It helps you understand how actively people are interacting with your content.
- Follower Growth Rate: Keep tabs on how your audience is growing over time to gauge your reach and influence.
- Reach: A critical metric to see how much of your content is making it to people outside your existing follower base.
- Views: Tracks how far and wide your content is being seen, giving you insight into its overall visibility.
By focusing on these metrics, you'll have a clearer picture of what’s resonating with your audience and driving meaningful interactions.
How do I connect Instagram data with GA4 or Shopify in one dashboard?
To bring Instagram data together with GA4 or Shopify in a single dashboard, you'll need a cross-channel reporting tool or a data integration platform. These platforms allow you to link your accounts by authorizing them through OAuth. Once connected, choose Instagram, GA4, and Shopify as your data sources. From there, you can set up the dashboard to show combined insights, like performance metrics, all in one place for a streamlined view.
How can I spot fake followers or bot-driven spikes in my dashboard?
Look out for abrupt, unnatural spikes in your follower count that don’t align with your content or marketing campaigns. One red flag is a noticeable drop in engagement rates as your follower numbers climb. Tools like UpGrow’s AI can help identify suspicious patterns, such as unbalanced follower-to-following ratios, incomplete profiles, or overly repetitive comments - hallmarks of fake accounts. Genuine growth tends to happen gradually and reflects the effort you put into your content and strategies.